How to display Min and Max value labels in a chart? The solution lies in the format of the numbers in your data series ????
Case study: Visiting a restaurant
We will start from the monitoring of people who enter a cafeteria for breakfast.

Step 1: Adding the Min and Max columns
As we have seen in this article, to display the minimum and maximum values in a graph, you need to add a column to calculate the minimum and maximum

For example to find the minimum, the formula is
=SI(MIN($B$2:$B$13)=B2;B2;0)
And for the maximum
=SI(MAX($B$2:$B$13)=B2;B2;0)
Step 2: Add the series to the graph
Two techniques are available to you for adding a series to a graph.
- You can do this by adding the series from the menu Select data

- Or, use the following technique by copy and paste for each series
Step 3: Do not display the min and max curves
Here, we cannot keep the min and max curves so as not to distort the initial curve
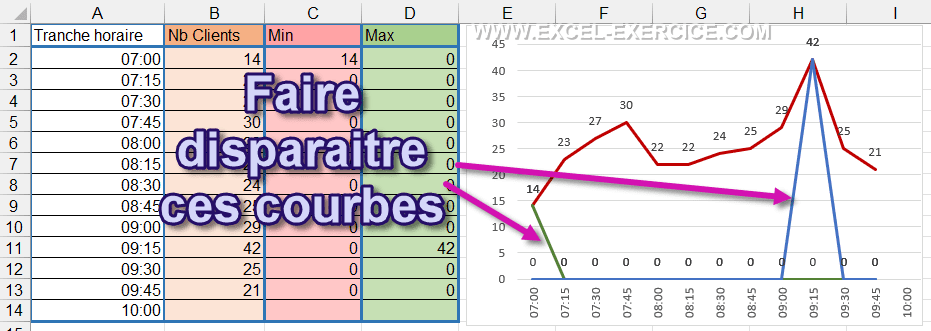
For that, it suffices
- Double-click on one of the 2 curves
- In the settings pane, choose the option No trait
- Repeat the same manipulation for the other curve

Like this, the curves have disappeared but the labels are still there ????????
Step 4: Change the background color of the min and max labels
Here, simply choose a background color to make the numbers stand out
- Select the label series
- Then the format option
- Choose option Plain Fill
- And finally the color

But all labels are impacted, even those with a value of 0 ????????

Step 5: Hide labels to 0
Last step, you must now "hide" all the labels which have a value of 0.
To do this, we will “play” with the formatting parameters. Personalizing the content of a cell is divided into 4 parameters
- Positive numbers
- Negative numbers
- Zero
- The text
So, we will create a number formatting rule to hide all labels as 0 by playing on the 3rd parameter.
In the section Name, we select the option customizable and we enter the code is the following
0;-0;""
Immediately all data equal to 0 are no longer visible ????????

Video
Find all the techniques explained in this video

